4 Developing an Index
This chapter runs through the process of developing a whole index for a single nation. Its purpose is to demonstrate the top-level workflow and ideas, before later chapters dive into the technical, nitty-girtty details of the build process.
For demonstration purposes, let’s run through the workflow to build a Health Inequalities Index for Scotland.
4.1 End goal
The end goal is to compute a resilience score, which is a combination of vulnerability and capacity:
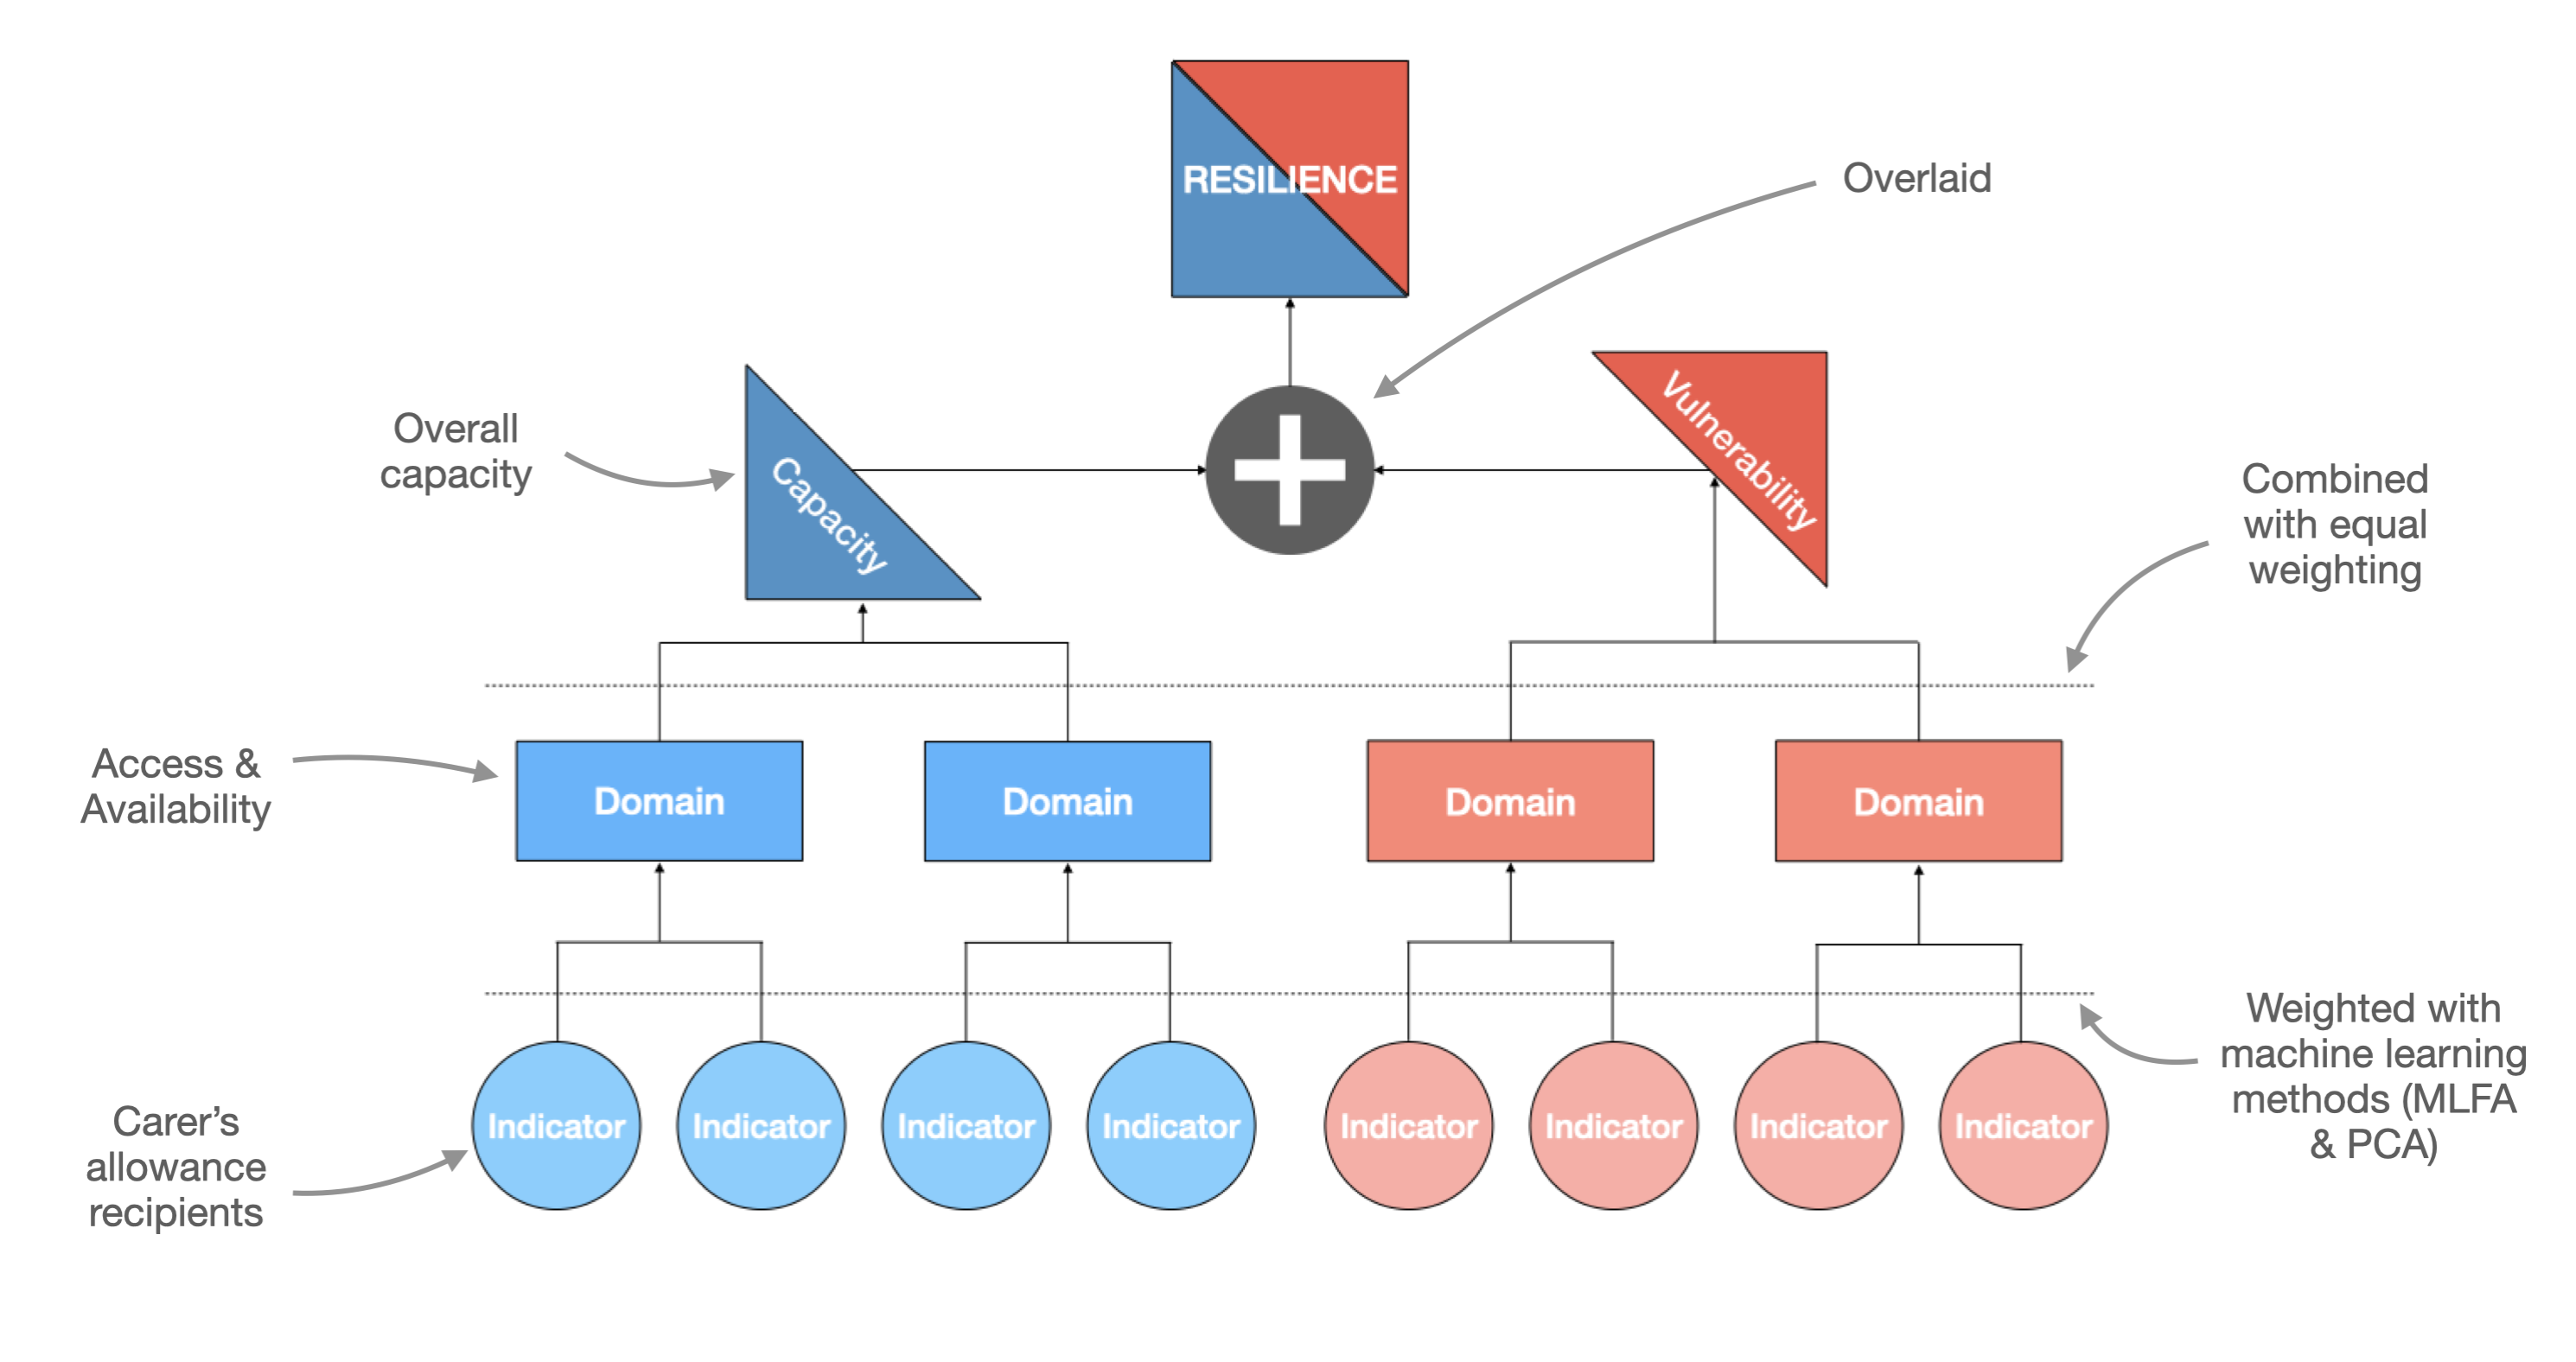
The process to achieve the end goal is as follows:
- Add indicators
- Combine indicators to form domains
- Combine domains and compute vulnerability and capacity scores
- Combine vulnerability and capacity scores to make an overall resilience score
4.2 Add indicators
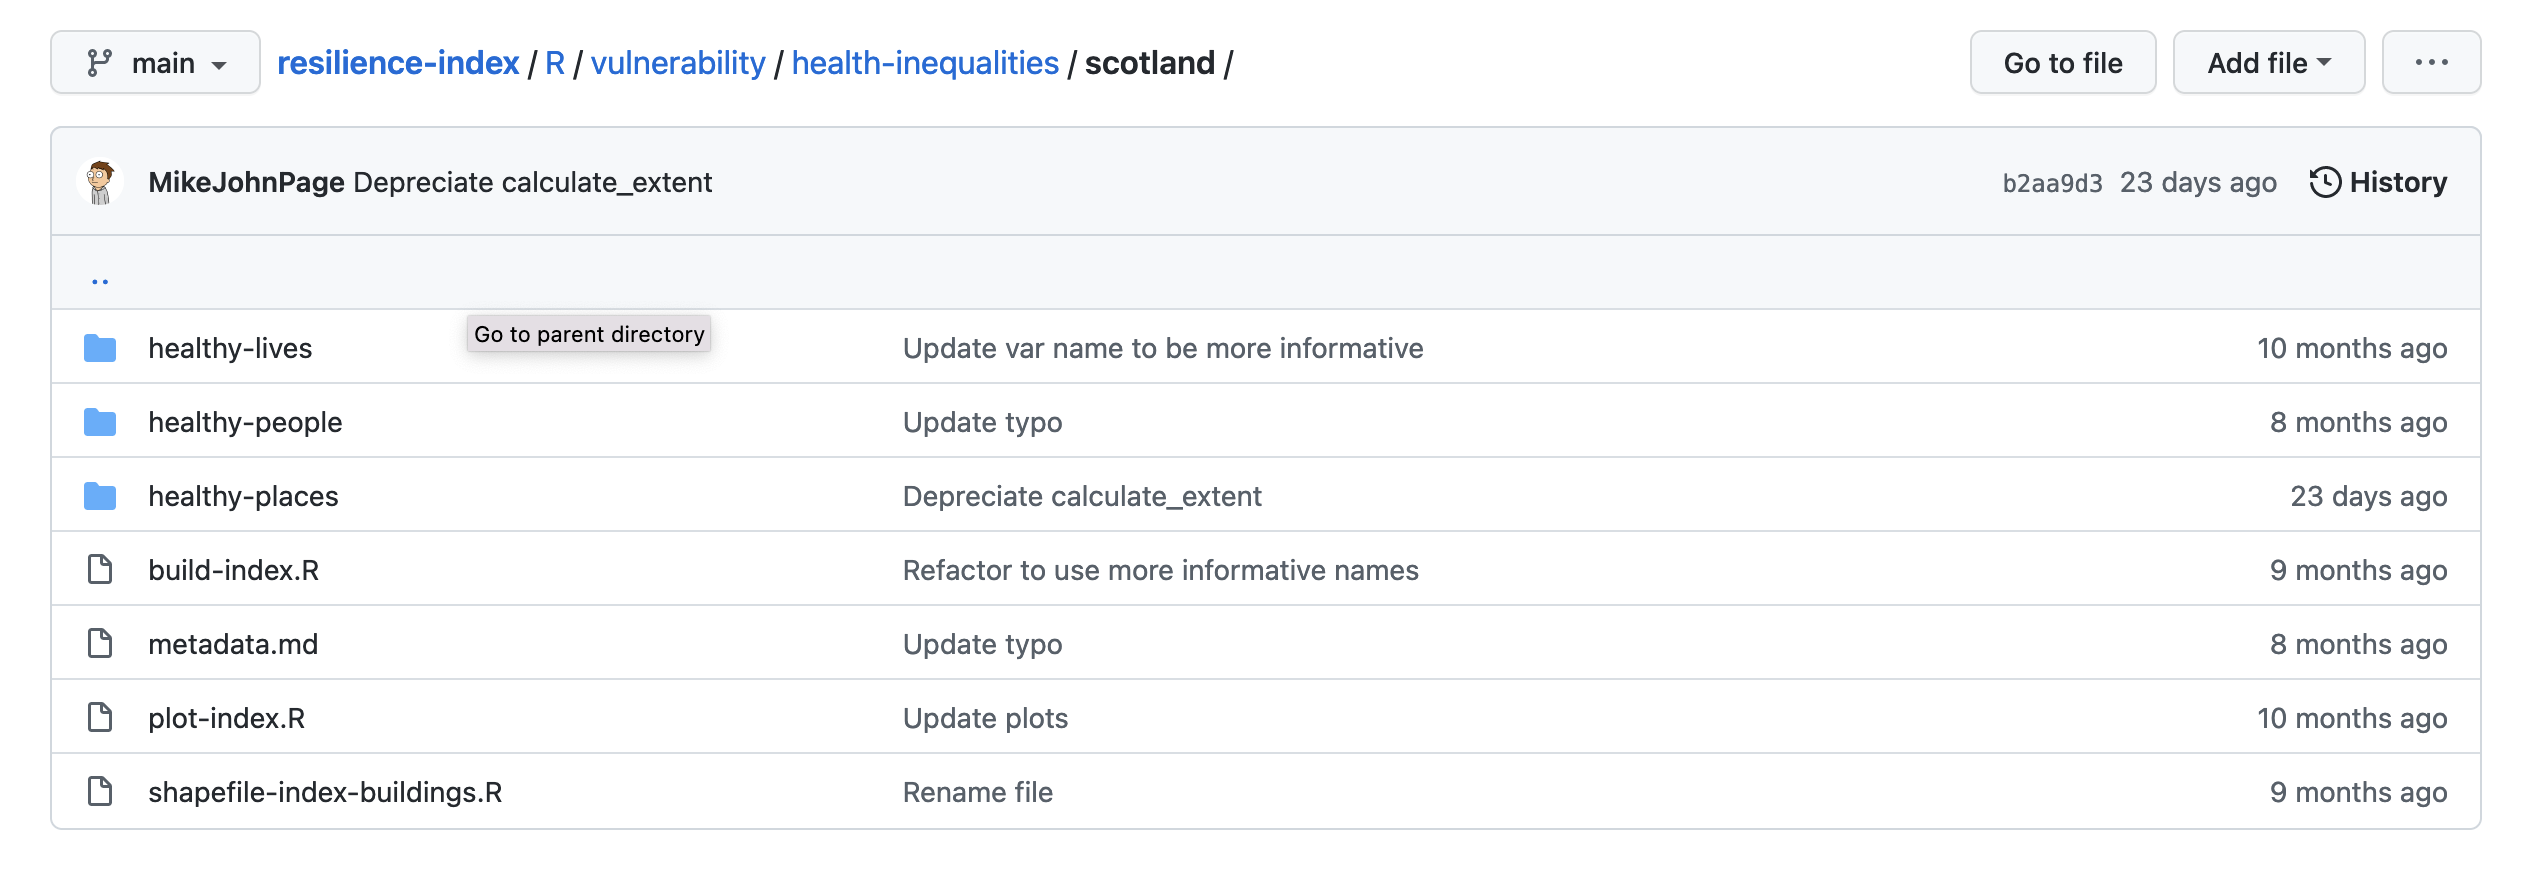
In the Resilience Index GitHub
repo, navigate to the correct domain/strategic-cause/nation subfolder.
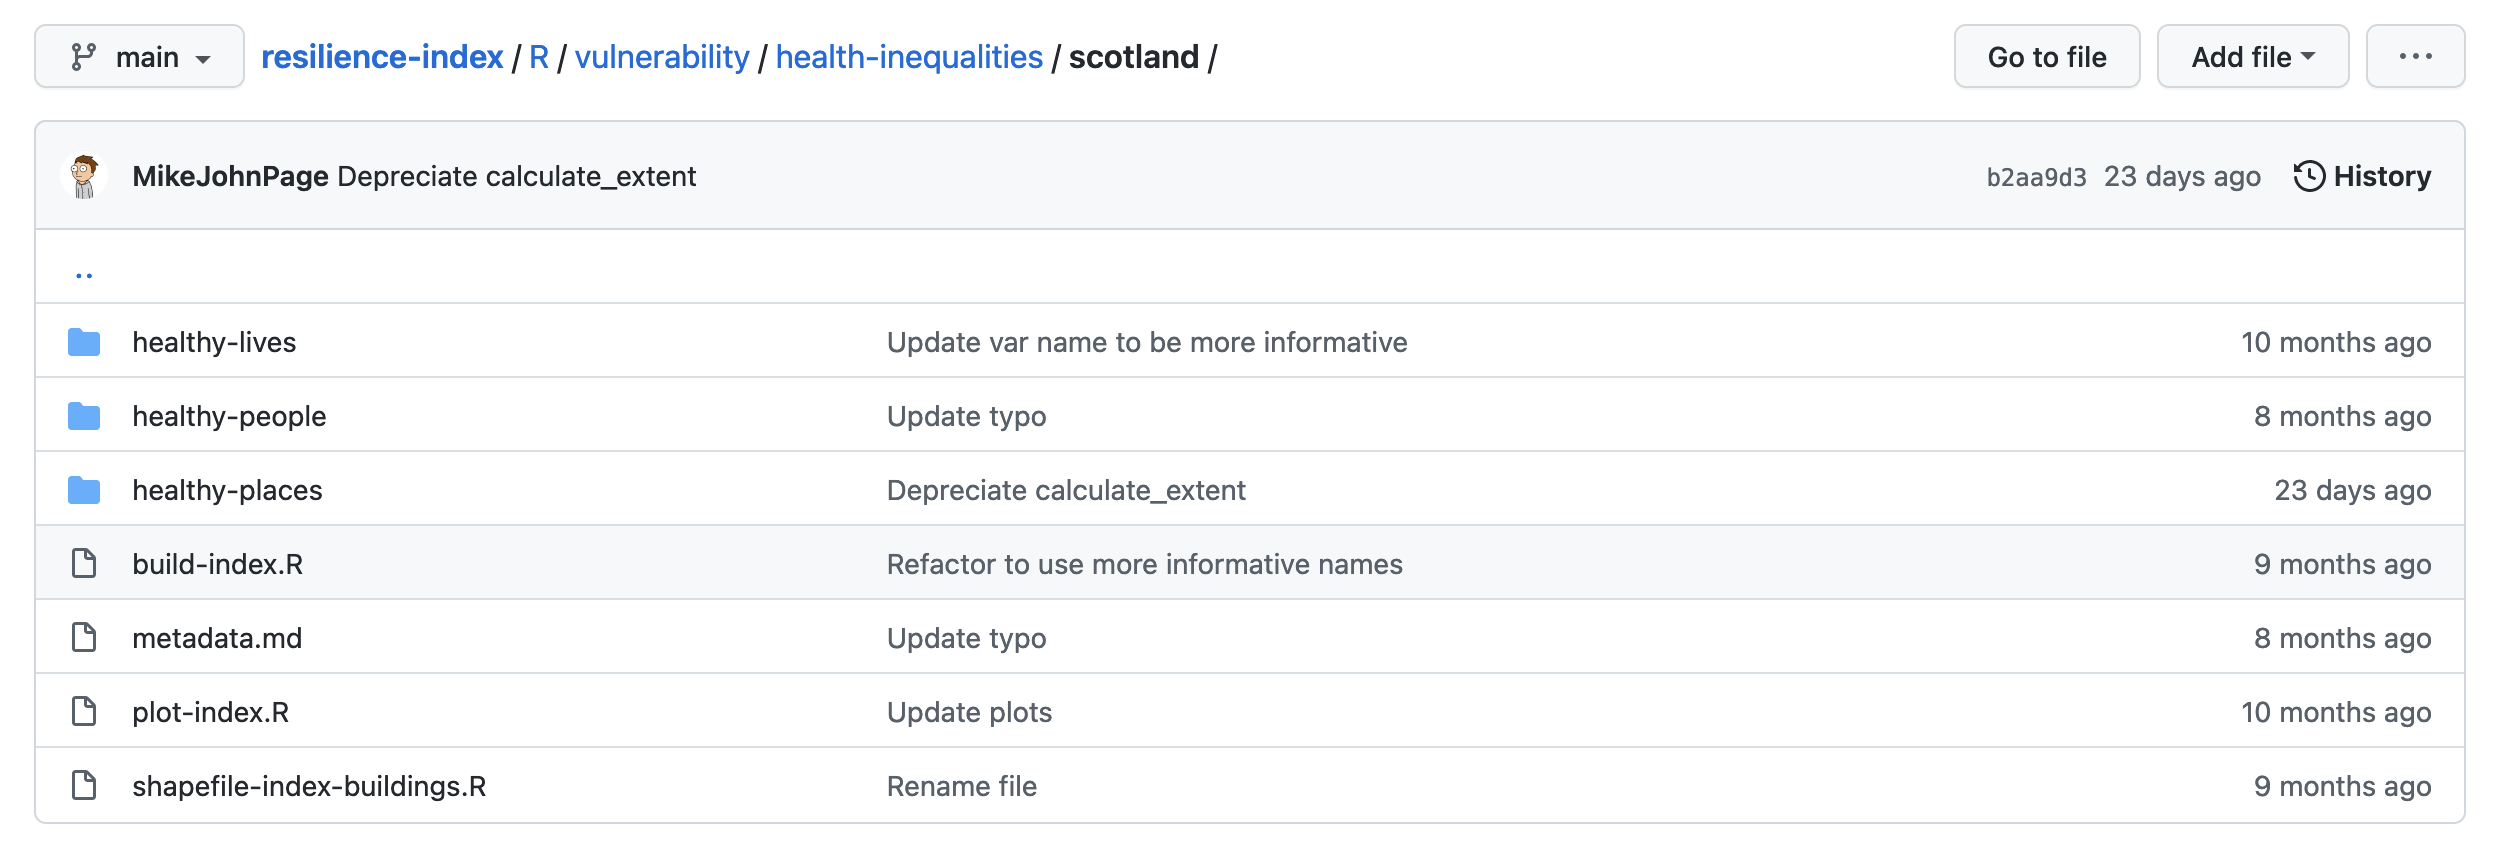
To add vulnerability indicators to the Scottish Heath Inequalities index,
navigate to R/vulnerability/health-inequalities/scotland:
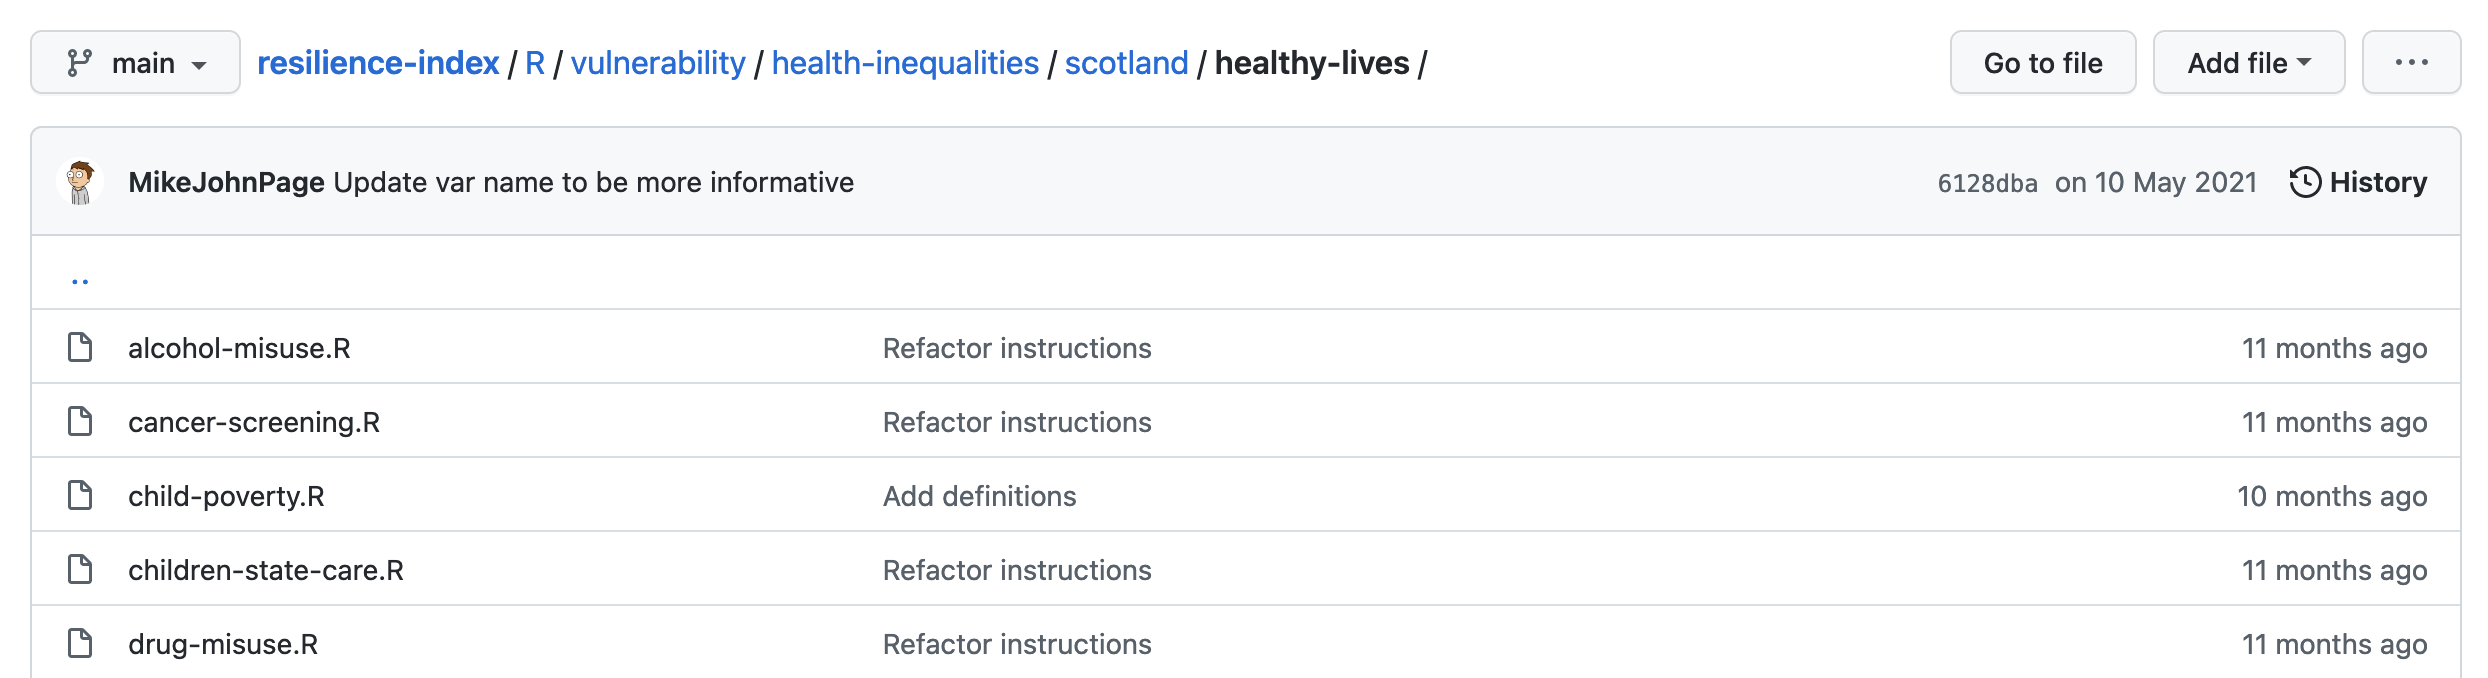
If the model has subdomains, like in the case above, navigate into the subsequent folder:
To add an indicator, add a new .R file. Each file should contain a stand-alone
modular script, that should compute the statistic for a single indicator:
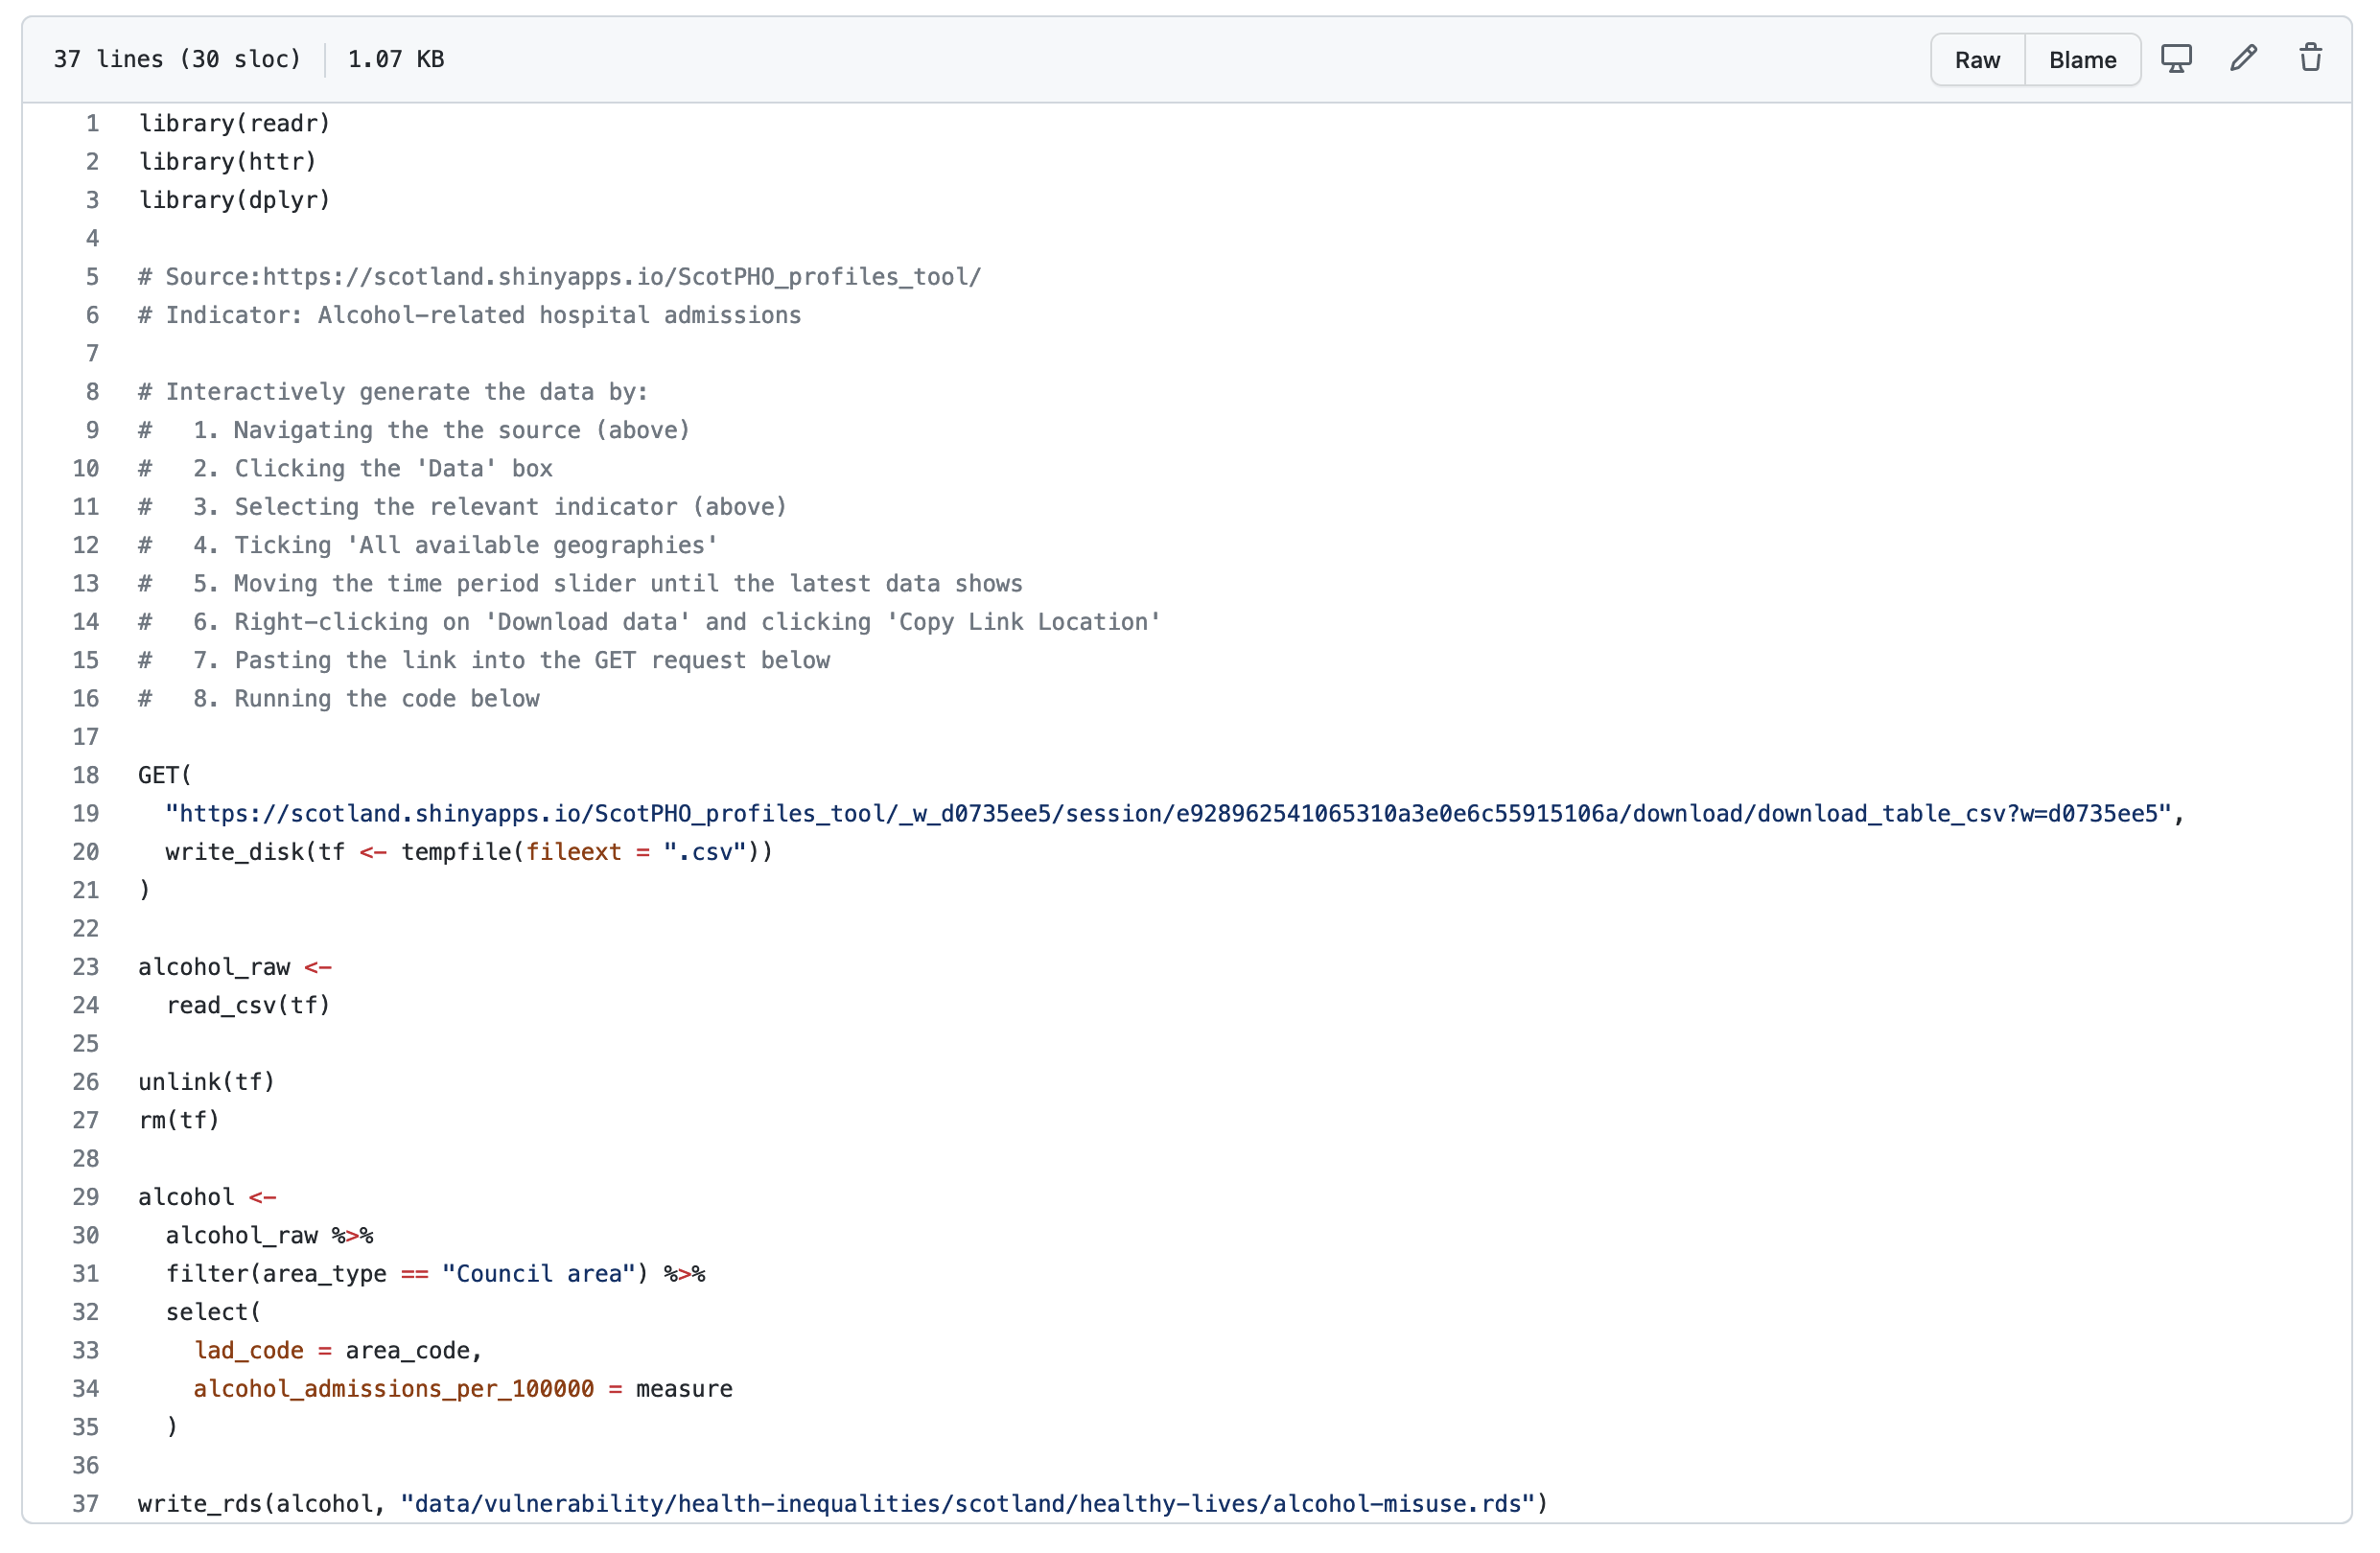
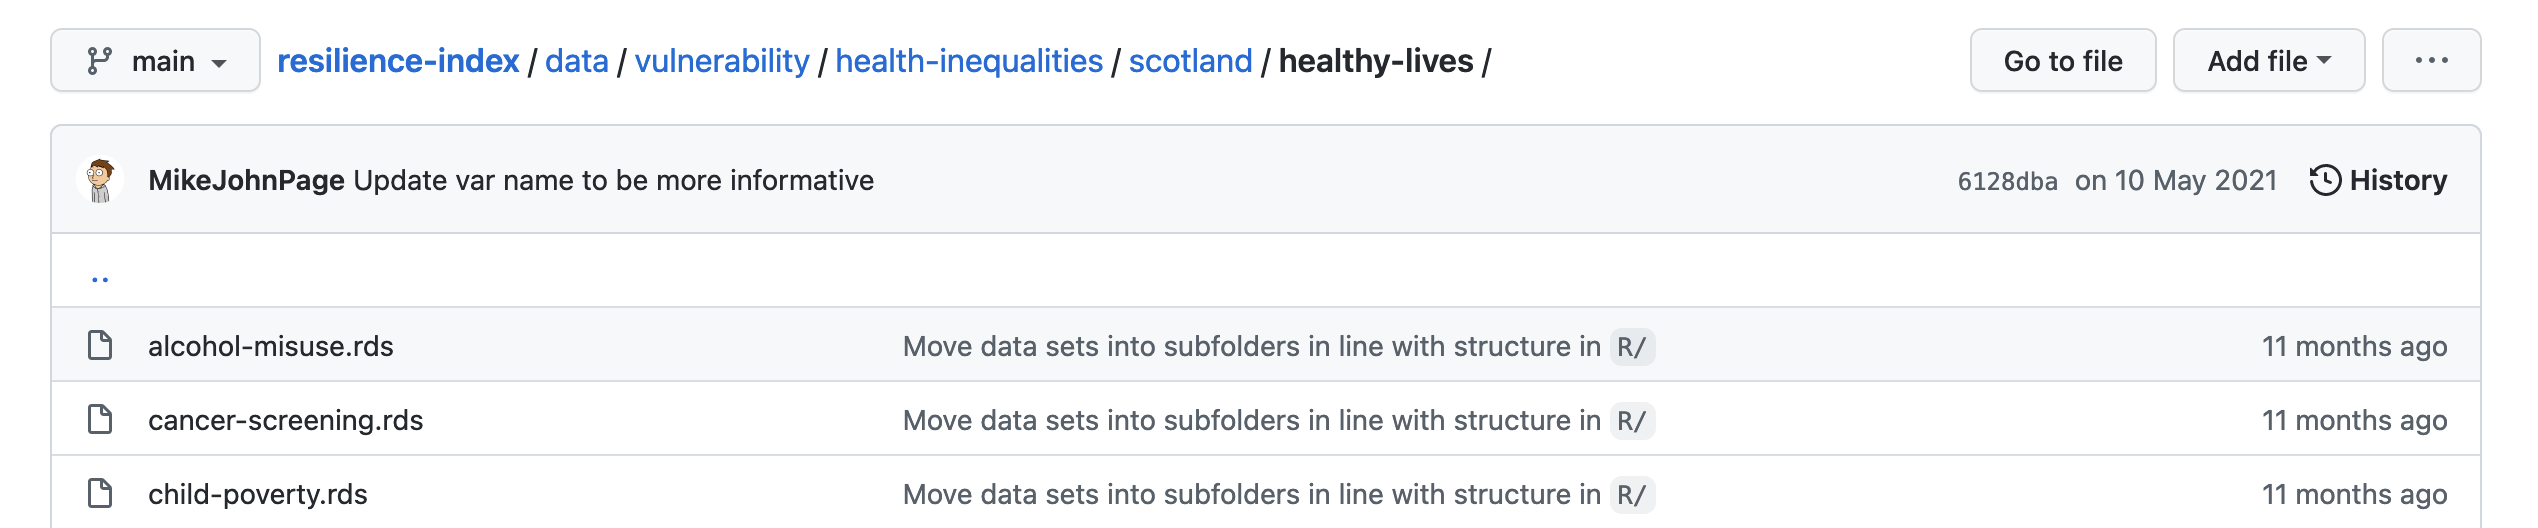
The output of this script is then saved in a .rds format in the data/ folder
in the root of the repo, in a structure which mirrors that of the file path in
the R/ folder:
4.3 Combine indicators
Once indicators have been added, they are joined in a build-index.R script,
located in the root of the domain/strategic-cause/nation subfolder:
The process to combine domains varies by the strategic-cause and model of interest. The OECD handbook on constructing composite indicators should be used as a reference text throughout. To combine vulnerability indicators for Scottish Health Inequalities, the following steps needs to be taken:
- Load indicators into the R session:
# Load indicators
healthy_lives_indicators <-
  load_indicators(
    path = "data/vulnerability/health-inequalities/scotland/healthy-lives",
    key = "lad_code"
)- Scale and align the indicators so that higher values equate to higher vulnerability scores: multiply misaligned indicators by -1:
healthy_lives_scaled <-
  healthy_lives_indicators %>%
  mutate(
    gcse_qualifications_percent = gcse_qualifications_percent * -1,
    healthy_eating_percent = healthy_eating_percent * -1,
    job_related_training_percent = job_related_training_percent * -1,
    activity_levels_met_percent = activity_levels_met_percent * -1,
    vaccine_rate_mean = vaccine_rate_mean * -1,
    young_people_training_percent = young_people_training_percent * -1,
    cancer_screening_percent = cancer_screening_percent * -1
  )
Apply functional transformations (e.g., log) to address non-normal distributions if necessary
Normalise indicators to a mean of 0 and SD +-1:
healthy_lives_weighted <-
  healthy_lives_scaled %>%
  normalise_indicators()
Weight indicators using PCA or MLFA if appropriate
Calculate domain scores by ranking and quantising the (weighted) normalised scores:
  healthy_lives_weighted %>%
  calculate_domain_scores(
    domain_name = "healthy_lives",
    num_quantiles = 10
  )
4.4 Combine domains
Combine domains with equal weighting and rank and quantise the output to produce a composite score:
health_inequalities_scores <-
  healthy_lives_scores %>%
  left_join(
    healthy_people_scores,
    by = "lad_code"
  ) %>%
  left_join(
    healthy_places_scores,
    by = "lad_code"
  ) %>%
  select(
    lad_code,
    ends_with("domain_score")
  ) %>%
  calculate_composite_score(
    index_name = "health_inequalities",
    num_quantiles = 10
  )
4.5 Combine vulnerability and capacity
Currently, vulnerability and capacity composite scores are not computed on to produce a resilience score. Rather, the two scores are plotted using a bivariate choropleth map, which examines the intersection of the two variables. For an example of how these plots are run, see here.